Education inequality is a persistent challenge in Malaysia. Even more so in Sarawak, where its large geography and scattered communities make it even more challenging to service. Still, education is a fundamental right and it is these communities that need this service the most.
We often hear of anecdotes: children crossing rivers to attend school, schools without internet, schools without enough teachers. But beyond the stories, what does the data tell us? When, where and why do students fall through the cracks?
Why this article?
This post is my attempt to answer those questions. I use publicly available data to understand education inequality in Sarawak.
I should say upfront: I am not an expert in education. This is my attempt to establish a baseline understanding, and I welcome insights or corrections from those who know this space better. Still, I hope these notes are helpful to others who, like me, are trying to better understand the realities of education inequality in Sarawak and Malaysia.
Sarawak vs. National Average
Although educational attainment levels in Sarawak have improved over time, Sarawak has traditionally seen lower educational attainment compared to the national average.

Source: GlobalLabData.org
In 2022, Sarawakians aged 25 and above had, on average, just 8 years of schooling. This is well below the national average of 11, and far behind the 13 years seen in places like Selangor and Kuala Lumpur.
This points to a three-fold challenge. First, Malaysia’s most educated individuals in migrate to urban centres like KL, Selangor and Penang, skewing averages in both the origin and destination states. Second, a notable share of Sarawak’s population today has not completed secondary school, limiting access to jobs, incomes and life opportunities. Third, and most fundamentally, Sarawak has historically lagged behind in educational attainment. It is the this third point that we explore further.
Enrolment/Dropouts in Primary and Secondary School
To understand what lies behind Sarawak’s lower attainment, we begin by tracing when students start to drop out.

Using data from the Ministry of Education (MOE) and OpenDOSM, we estimate the share of each cohort reaching each formal education stage in Sarawak and Malaysia. This is done by comparing the number of enrolled students against the live births of the corresponding cohort. For example, Primary 1 enrolment in 2022 is matched with live birth data from 7 years prior in 2017 (see methodology here). The percentage of cohort that progress through schooling is then estimated using school completion rate data.
In Sarawak, an estimated 82% of each cohort completes Form 5, slightly below the national average of 85%. But the real difference lies in when students begin to drop out. Nationally, dropouts only becomes significant after Form 4, meaning that the Form 3 to Form 4 transition is the key bottleneck. In Sarawak, however, the steepest decline happens much earlier, between Primary 6 and Form 1.
This means that while primary school access is nearly universal, inequality begins to widen at the secondary level.
Inequality Within Sarawak
Urban vs Rural Sarawak
The real challenge for Sarawak is inequality within the state. To understand this, we obtain data at the most granular level available – data split by division and administrative district. Sarawak can be split into 12 divisions, which is further divided into 40 districts.

Broadly, the urban areas are in Kuching, Miri, Bintulu and Sibu. These are coastal areas where human activity is most abundant. Areas adjacent to these cities can be considered semi-urban-rural. While the inner mountainous regions of Sarawak are considered fully rural, with limited infrastructure and sparse populations.
The graph below classifies districts as either Bandar (urban) or Luar Bandar (rural or semi-urban-rural). Though, it should be noted that this classification can still mask large differences within regions simply due to how the boundaries are drawn. For example, the Miri district includes both Miri City and also Bario. Miri City is a community of ~250,000 residing in one of the main economic centres of Sarawak; whereas Bario is a community of ~1,500 residing in one of the most rural areas in the Highlands of Sarawak. Still, the classification helps contrast areas with urban centres against those without.
Clicking on the figure will take you to an interactive dashboard with district-level indicators such as population density, poverty, and infrastructure access.

Next, we plot the location of schools. Sarawak has an estimated number of 1,270 primary schools and 212 secondary schools (including private schools). Clicking the image below links to an interactive dashboard with school locations and key details of each school.
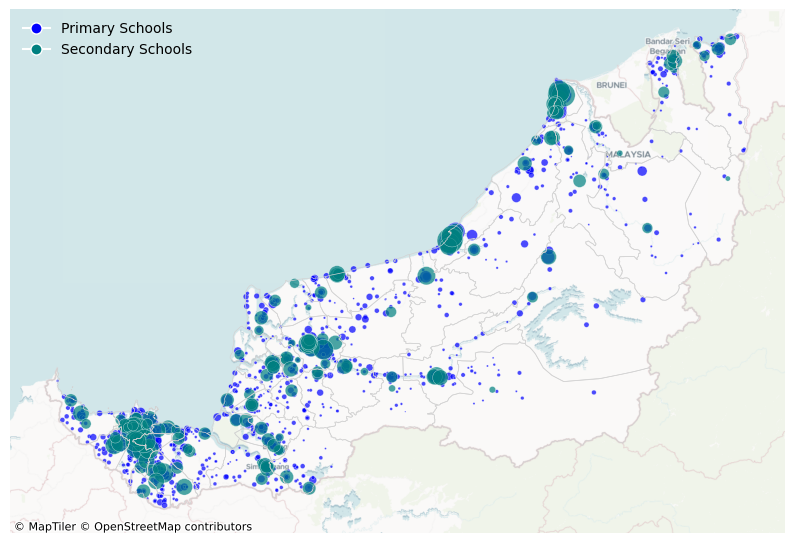
At first glance, disparities in access are clear. Primary schools are widely distributed, while secondary schools are more centralised. Urban areas have dense clusters of schools, whereas rural districts may rely on a single school for the entire area. Although the population in remote districts are low, they are spread out. These students travel large stretches to get to school, or attend boarding school even at a young age.
Enrolment/Dropouts in Primary and Secondary School by District
Percentage of Cohort to Reach Education Stage (Enrolment Rate)
To understand district-level disparities, we compare 2020 enrolment figures to cohort sizes based on estimated historical live births (e.g. Primary 1 enrolment in 2020 is matched to 2013 births, using district level census and JPN data). School completion rates by district are obtained using DOSM data. This provides an approximation of the share of each cohort reaching each education stage.
The graphs below present two perspectives:


Dropouts and Enrolment Increases at Each Education Stage
When and where do students drop out? Dropout rates are calculated as the difference in cohort percentages between education stage. For example, the share reaching Primary 6 minus that for Primary 1.
Note that districts with changes below 5% are excluded due to uncertainties in live birth and enrolment data. This does not mean that these districts are not important, but rather that we refrain from drawing conclusions where the data may be too uncertain to interpret reliably.

Next, we estimate the scale of impact. We convert dropout percentages into absolute numbers by multiplying them with the average annual live births in each district (2003–2013). For example, a 10% dropout rate in a district with 1,000 births per year suggests about 100 students per cohort do not make it to secondary school.

Once again, access to primary education is nearly universal. The sharpest disparities emerge at the transition from Primary 6 to Form 1.
Percentages vs Absolute Values
To fully interpret this data, we must consider both percentage and absolute perspectives. Both show different sides of the story.
Let’s take Kuching and Bukit Mabong as examples; Sarawak’s most urbanised and rural districts. Kuching has around 10,000 births a year; Bukit Mabong, just 350. In Bukit Mabong, about 50% of children do not reach Primary 1, while in Kuching it’s only 5%. Yet in absolute terms, that’s ~175 children in Bukit Mabong and ~500 in Kuching.
The percentage view highlights inequality of opportunity; a child born in Bukit Mabong has only a 50% chance of entering school while in Kuching, 95%. The absolute view shows where the largest number of students are affected.
Does this mean that one is more important than the other? Not at all. Small numbers in remote areas deserve urgent attention, just as small percentages in populous areas do. But the nature of the challenge for each is different and requires a targeted response.
The Toughest 4%: Primary School Dropouts in Sarawak
Primary school enrolment in Sarawak is almost universal at 96%; yet, it is the final 4% that is the hardest to reach. Where are these students?

Aside from Kuching, most of the districts with significant dropouts (i.e. Bukit Mabong, Tatau, and Belaga) are located in Sarawak’s interior, where populations are smaller and more spread out. In these areas, an estimated 50 to 250 children per district may not be starting school each year. This could be due to logistical barriers to accessing education, such as distance and infrastructure. However, some children may have moved or enrolled in boarding schools, which start as early as the primary level. Higher child mortality rates in remote areas may also be a factor.
This brings us to a key limitation to this method. We cannot distinguish between children who have moved and those who have genuinely dropped out. We assume, on average, that most children attend school near where they are born; this assumption may break down when we look at more rural and dispersed regions. Still, it provides a reasonable approximation of educational attainment. And, it is clear is that many children in remote areas still lack access to nearby schools, even at the primary level.
Samarahan also stands out, as it sees notable ‘dropouts’ despite being a semi-urban-rural region. While some of this may reflect actual dropouts, it is possible that many students are just attending school in neighbouring Kuching instead. This is a qualitative judgment, but it is supported by the concentration of schools near the Kuching-Samarahan boundary and the relatively strong connectivity between the two districts.

Inequality Widens: The Primary 6 to Form 1 Transition
The transition from Primary 6 to Form 1 is where the largest number of student dropouts in Sarawak occurs. Yet, one unexpected finding is that some districts report more Form 1 students than Primary 6 students, even after controlling for the differences in live births between cohorts. This can be explained by three main factors:

(1) Boarding schools distort the data

At the secondary level, many students rely on fully boarding schools such as SBPs and MRSMs, which are located in Kuching (SM Sains Kuching, SM Sains Kuching Utara, MRSM Kuching), Miri (SM Sains Miri), Betong (MRSM Betong), and Mukah (MRSM Mukah). Students are counted in the district where the school is located (not where they are from) creating a statistical artefact. Unsurprisingly, the districts showing the largest increases in Form 1 enrolment are also those hosting these boarding schools, which draw students from across Sarawak.
(2) Inter-district movement into more urban areas
Some districts also show declining enrolment as students move to secondary schools in neighbouring urban centres. These shifts are easy to spot. One district shows a clear drop in enrolment while its urban neighbour shows a gain. For example:

As shown above, some of the districts where this is likely happening is in Samarahan -> Kuching, Lundu -> Bau or Kuching, Selangau -> Sibu, Dalat -> Mukah.
It is important to note that not all student movement reflects physical migration. Secondary schools are typically centralised in district town centres, so students living near district borders may be geographically closer to schools in neighbouring districts than their own. Additionally, some families may choose to send their children to better-resourced urban schools, even if it means travelling further to get to school.
(3) Risk of actual dropouts in remaining districts
We highlight the first two patterns to distinguish movement from actual dropouts. Even after accounting for these factors, many rural districts still show signs of significant dropout risk.
These are areas that typically have a wide distribution of primary schools, but there are no secondary schools nearby. The existence of multiple primary schools shows that there are children and active communities around the area; but where do they go after that? Boarding school places are limited, road access is poor, and the nearest secondary schools are far. In these areas, students are likely to face the greatest barriers in continuing their education. Two examples are explored below.


Dropouts Continue: Secondary School
Dropouts continue to be observed throughout secondary school. I will not go into too much detail so as to not be too repetitive. There is a good paper on this which obtained actual data (not estimates) from Jabatan Pendidkan Negeri Sarawak (JPNS) on dropouts between 2013-2018 written by Danggat et al, for further reading.

Why do Students Drop Out?
Throughout this article, we focused on the geographic barriers that shape education access. In particular, how physical distance, infrastructure gaps, and school availability impact dropout rates. However, dropouts are not due to a single factor; but many factors contributing to circumstance. To complement our quantitative analysis, we turn to qualitative studies that shed light on some of these lived experiences.
These include (1) a survey of 120 dropouts across Sarawak’s 12 divisions (urban and suburban) (Dolly P.C et. all, 2024); (2) a interview case study in Lubok Antu Rickie G. & Alias B.S.B, 2024); and (3) interviews with teachers and students from a rural school in Belaga (Sofianie Sulaiman, Wan Muna Ruzanna Wan Muhammad, 2024). Across these, a few themes emerge:
Poverty and Transport
In many rural areas, the cost and distance of getting to school is prohibitively high.
“… the most common problem here is among families with low income. Due to unstable family socioeconomic conditions and lack of a steady income, parents cannot afford to buy fuel for their boats to send their children to school. Parents have to buy a drum of boat fuel, estimated to cost around RM120 for a round trip, as it takes 3 hours by boat to reach the school from the longhouse. This cost becomes a burden for them. As a result, they face difficulties sending their children to school due to the high transportation costs.”
– Data Teacher and Year 5 (Primary School) Class Teacher (Source: Rickie G. & Alias B.S.B, 2024, emphasis is mine)
“Kalau tak ada duit memang saya tidak bisa pergi. Sebenarnya saya suka pergi.”
– A primary school student in Belaga (Source: Sofianie Sulaiman, Wan Muna Ruzanna Wan Muhammad, 2024)
These constraints begin even at a primary school level.
Family Responsibilities and Parental Support
Dropouts are more common among students from large families (families with 3-6 children), especially the eldest, who may choose to leave school to work in order to support the household (Dolly P.C et. all, 2024). Additionally, pupils with family responsibilities, such as caring for sick or disabled family members, are also prone to dropout (Rickie G. & Alias B.S.B, 2024).
Besides that, the lack of parental support also causes dropouts. For example, in remote areas where there is lack of job opportunities, parents may have to move to the cities and other areas (i.e. the kebun) periodically for work. They may bring their children with them, disrupting the child’s education; or, they may leave their children behind with guardians such as grandparents. (Rickie G. & Alias B.S.B, 2024 and Sofianie Sulaiman, Wan Muna Ruzanna Wan Muhammad, 2024)
In my school, most students do not live with their parents. Instead, they live with their grandparents in longhouses because their parents work in the city. Parents only return to the village during school holidays. When these students live with their grandparents, the grandparents tend to comply with and fulfill any wish of their beloved grandchildren. For example, if these students do not want to go to school, their grandparents will not scold them; instead, they will just follow the wishes of their grandchildren.
– Teacher at a school in rural Sri Aman, Sarawak (Rickie G. & Alias B.S.B, 2024)
Besides that, parents who themselves lacked formal education may not view schooling as essential. In such environments, dropping out is seen as normal rather than exceptional, making it socially acceptable. And even if they see the importance, they may not be well placed to support their children.
“Additionally, the home environment also affects students’ absenteeism at school. As we know, many of these students live in longhouses. When one family observes that other families are not sending their children to school, they are also reluctant to send their children because they see it as a common and acceptable practice, since others are also not sending their children to school.”
– Data Teacher and Year 5 (Primary School) Class Teacher (Rickie G. & Alias B.S.B, 2024, emphasis is mine)
Child Marriage and Pregnancy
One of the more heart-breaking findings is the link between adolescent pregnancy and school dropouts (Dolly P.C et. all, 2024). Students either drop out of school and then choose to get married at a young age, or they choose to drop out after experiencing unplanned pregnancies (often due to lack of awareness and education).
“I didn’t study at the time of my marriage. I attended school only until Primary 6 (at 12 years old). I stopped because my parents couldn’t afford it. My parents didn’t work; they only planted wheat in a long house.”
“Because we were in a difficult life, and when we get married, the husband will pay for everything. So, we have an open mind, as they say, when, how to say this, we won’t burden our parents too much (by getting married) because I have five siblings. So, my parents had fewer burdens and could send my younger siblings to school. I, too, after I got married, could help my siblings. I bought them clothes, trousers and a little food. At the end of the month I sent them money too. I got married, and my parents’ lives got easier.”
– Respondent, married at 14 years old (Kohno, A. et. al, 2020)
Lack of Documentation
“Students lacking complete documentation for school registration (e.g. parents without identification documents or students without identification documents like identity cards or birth certificates) contribute to dropout rates. Schools and school clerks have made efforts to help and advise parents or guardians to manage the necessary documents, but unfortunately, there seems to be a lack of effort from parents and guardians to handle these issues.”
– Year 6 (Primary School) Class Teacher (Rickie G. & Alias B.S.B, 2024)
Studies in the past have shown that there is an under registration of births, especially in more remote districts. (Lai, S.L., Tey, N.P, 2021). The scale of this issue is difficult to quantify; after all, you don’t know what you don’t know. Unregistered children are effectively invisible and can miss out on school entirely.
Other reasons
Other reasons include poor infrastructure maintenance, overstretched and under-resourced school staff, and frequent changes in school administrators. Some students also lack personal motivation, often because they don’t immediately see how education connects to their lives or future opportunities. These challenges compound the structural barriers faced by these communities. (Rickie G. & Alias B.S.B, 2024)
Limitations
All numbers shown in this article are estimates not actual data, and therefore should not be quoted as actual numbers. Due to limited district-level data, gaps were addressed using interpolation, averaging, and cross-referencing multiple sources. Caveats are mentioned in the article where relevant. While every effort was made to apply reasonable assumptions and minimise error, the results are indicative, not definitive. They should be interpreted as broad patterns rather than precise counts. (full methodology details are available here).
Underexplored Themes
The Impact of Covid
This article focused on broad trends, mostly using data from before 2020. It does not consider the impact of Covid-19, which will have had uneven impacts across the districts. In interviews published as recently as 2024, teachers highlighted that many students, especially in rural areas, are not returning to school as they are used to staying at home for more than two years. Even in more urban areas like Miri city; when I went back just a few months ago, I learned that teachers preparing students in Form 4/5 to sit for the SPM were still catching their students up from material in Form 1-3. One can imagine that these learning losses are even more severe in rural areas.
There are a few groups of concern. (1) Students who had access to online learning but struggled to keep up; (2) students who dropped out and later returned but are now behind, and; (3) students who dropped out and never came back.
There has been a lack of studies especially focused on these areas (at least publicly). Because of this, we don’t know how many students are impacted and how many students are in each group, which makes it difficult to fully address these gaps.
Further Inequality Beyond Form 5
Besides that, article focused on education from primary to secondary school, and inequality extends even further beyond Form 5. JPNS data shows that only ~86% of Form 5 students who sit for SPM pass SPM; what happens to the rest? Among those that passed, some may pursue tertiary education and some may not. Among those that pursue tertiary education, some may go to other parts of Malaysia (and a small minority, abroad) while others may study locally. Those that have the resources to migrate may find themselves having different opportunities compared to those who stay.
Beyond school, the path becomes less clear and inequality persists in ways that we still may not fully understand.
Working Age Adults
Finally, this study began by noting that working-age adults in Sarawak have lower educational attainment than the national average. Improving access for current students is one part of the solution, but what about adults who have already left school? Where do they live, and what opportunities are available to them? This group matters because creating high-tech, high-value jobs will have little impact if most people cannot access them. We must either support reskilling or find ways to improve livelihoods through the work they already do.
Conclusions
When, where and why do students dropout in Sarawak?
When: while access to primary education is nearly universal, students start to dropout most noticeably during the transition between Primary 6 to Form 1. This is much earlier compared to the rest of the country, where dropouts typically occur at the upper secondary level. Further dropouts continue during secondary school, during Form 1 up to Form 5.
Where: both rural and urban districts see steep dropouts from secondary school onwards. Rural districts see large dropouts in percentage terms, while urban districts see large dropouts in absolute terms. Both challenges are different in nature and equally important to address.
Why: The reasons are complex. Children in rural districts face steep barriers as secondary schools are less accessible compared to primary schools. The distance and costs of getting to school can become prohibitively high. Some of these students may opt to go to boarding school which are located in urban areas; yet slots are limited and the remaining may drop out. On top of geographical access, there are also socioeconomic pressures that impact both rural and urban students. For example poverty, family responsibilities, child marriage, the lack of documentation and a general lack of motivation due to a disconnect between education and future opportunities. All these factors compound, leading children to fall through the cracks long before they finish school.
This article attempted to shed light on education inequality in Sarawak from a data perspective. It achieves this by cross referencing multiple public sources of data, digitising these sources, presenting calculations of what these data indicate, and the production of dashboards to enable future public work on this topic more accessible.
The limits of data, however, is that it can only ever complement our understanding, not over-ride, lived experiences. As we repeatedly emphasise, Sarawak’s vast geography and dispersed population means that the lived experiences of people from district to district, and even within districts can be very different. Why students drop out in one area can be very different from another. Addressing these challenges requires deep, localised understanding beyond what this article can offer. There is a tendency among data practitioners to try to spot patterns and generalise, but it is these differences in lived experiences that matter most. This is most well put by Felicia in her PhD thesis:
With most research focusing on using numerical data to generalise findings, multi-layered experiences that are unique to individual schools, teachers, and classrooms are somewhat undermined. When these experiences are not taken into account and the complexities of classrooms are reduced to numbers on a paper, education reforms unfortunately take only the numerical data into account and neglect what makes each classroom, teacher, and therefore instructional coach, contextually and uniquely different from each other. (Source: Thersan, Felicia Genie, 2023)
To this end, I deeply respect the teachers and administrators who work with these children on a day to day basis to ensure that they have the best education possible.
This exploration has been a personally meaningful project to help me understand a topic that has long been an interest of mine. I hope that the notes here will be useful to you too. Above all, throughout the process of writing this article, I am repeatedly reminded of how fortunate I am to have had access to a good education and to have been blessed with good teachers in my life. This is the little I can do to raise awareness, in hopes that we find ways to make sure that these children have that too.
Additional Reading
I highly, highly recommend these sources (which were also used in this post):
- Tersan, F.G. (2023) Coaching across cultures: A narrative inquiry of instructional coaching in rural Sarawak, Columbia Academic Commons. Available at: https://doi.org/10.7916/rcy6-2967 (Accessed: 22 June 2025).
- Chabo, D., Masron, T., Jubit, N., & Yaakub, N. F. (2022). Spatial Temporal of School Dropout Hot Spot: A Case Study of Sarawak District Education: Analisis Hot Spot Ruang Masa Keciciran Sekolah: Kajian Kes Sempadan Daerah Pendidikan Negeri Sarawak. GEOGRAFI, 10(2), 54-68. https://doi.org/10.37134/geografi.vol10.2.4.2022
- Rickie, Gabriel & Alias, Bity. (2024). Students Dropout in Rural Schools in Sarawak: Causes and Proposed Solutions. International Journal of Academic Research in Progressive Education and Development. http://dx.doi.org/10.6007/IJARPED/v13-i4/24375.
- Dolly Paul Carlo, Athirah Azhar, & Tharshini Sivabalan. (2024). UNDERLYING SCHOOL DROPOUTS ISSUES IN SARAWAK . International Journal of Business and Society, 25(1). https://doi.org/10.33736/ijbs.6923.2024
- Kohno, A., Dahlui, M., Nik Farid, N.D. et al. Why girls get married early in Sarawak, Malaysia – an exploratory qualitative study. BMC Women’s Health 20, 46 (2020). https://doi.org/10.1186/s12905-020-00911-z
- Sofianie, S., Wan Muna Rizanna, W.M., (2024) Faktor Keciciran Murid di Sekolah Peribumi Penan. International Journal of Advanced Research in Education and Society. https://doi.org/10.55057/ijares.2024.6.1.38
- Lai, S.L., Tey, N.P. Deficiency in civil registration and vital statistics reporting in remote areas: the case of Sabah, Malaysia. Genus 77, 22 (2021). https://doi.org/10.1186/s41118-021-00132-8
Dashboards Created for This Article:

Workbook:
- All the cleaned data, calculations and sources are documented in this workbook for future work: databook

Methodology Notes:
- Methodology is documented here
Notes/Updates
22/06/2025
First publication of this blog post.
18/11/2025
Five months on since the first publication of this article, the Ministry of Education (MOE) Malaysia has released updated enrolment figures for October 2025 via a dashboard.
As explained earlier in this article, the initial numbers published were estimated using various techniques due to the lack of comprehensive data. They were not intended to produce exact figures, rather it was an attempt to form a view on broad patterns using publicly available data at the time. The estimates can give us an indication on where to look, but actual numbers must be verified through MOE and DOSM internally. The newly released dataset therefore provides an important update.
This new dataset validated some parts of the earlier analysis and introduced some nuance to others, which I would like to document here for the future benefit of readers.
The primary-secondary transition gap

One initial observation was that most dropouts in Sarawak occurred between Primary 6 and Form 1, whereas nationally they tend to occur between Form 3 and Form 4. This conclusion was based on Sarawak’s official enrolment statistics in 2017-2021.
The newly published dataset shows that the number of students in Primary 6 and Form 1 are both around 37k. At first glance, this may lead some to conclude that the transition gap has been resolved. However, we must keep in mind that these are cohorts of different birth years. A student currently in Primary 6 would have been born in 2013, which saw 40k births in Sarawak (source: DOSM). A student currently in Form 1 would have been born in 2012 which saw 43k births (source: DOSM).
When we consider the differences in cohort sizes, the conclusion changes. The % of cohort reaching Primary 6 and Form 1 are 92% and 86% respectively, which is actually lower than the original estimates of 96% and 90%. This suggests that the primary-secondary transition gap still presists, even if the enrolment numbers look similar.
However, as the 2017–2021 period showed, dropout patterns vary from year to year. To assess the situation properly, multi-year cohort data is essential. It would therefore be extremely helpful if MOE published these detailed enrolment statistics across several years, enabling clearer view of whether the primary-secondary gap remains today.
Inter-district movement
In the earlier analysis, we concluded that there was movement across districts into urban centres. Indeed, we see this too at MOE level data, where some PPD districts consistently have higher secondary enrolment than primary enrolment.

We were broadly right in some areas, and less so in others. For example, in our original analysis we estimated substantial inter-district movement in Kuching, Mukah, and Betong. The MOE dataset, however, does not show the same pattern. This mismatch is not straightforward to resolve because the two analyses use different geographic boundaries (administrative districts versus PPD boundaries) and involve different birth cohorts. These differences make direct, one-to-one comparison difficult.
Even so, the overall conclusion that interdistrict movement occurs still holds. The exact details of where exactly this is most prominent requires more detailed investigations.
Dropouts at the secondary school level
We also tried to estimate whether students were dropping out mainly at Form 1 or Form 4, but we could not do this with confidence.
The main limitation was the absence of district-level enrolment data broken down specifically for Form 1 (lower secondary) and Form 4 (upper secondary). As a workaround, we divided total secondary enrolment by five to approximate the size of the Form 1 cohort. This method can skew data in areas where schools only offer classes up to Form 3 (averaging artificially lowers estimated Form 1 enrolment and raises estimated Form 3 enrolment, which can obscure the true pattern of dropouts). We also relied heavily on school completion rate data in 2021-2023 to fill in the gaps, which had anomalies due to the immediate post-Covid period. Besides that, live birth data at the district level is also relatively sparse. And lastly, in rural districts with only a few hundred students, even small errors (20-50 students) can produce large percentage swings leading to different conclusions.
As a result, while estimates were produced, we could not fully verify its accuracy.
Some findings were correct. For example, we correctly identified significant drops at the Form 1 level in Selangau and Simunjan


Others were less accurate, such as in Dalat, where we previously estimated a decline between Primary 6 and Form 1, but MOE data instead shows an increase.

Again, it is important to note that the two datasets are not directly comparable. They use different geographic boundaries (administrative districts versus PPD boundaries) and represent different birth cohorts, making a one-to-one comparison difficult.
Overall
The updated MOE dataset helps us verify some of our earlier observations while refining others. I document the differences here for transparency, in case there are readers who are considering the use of this data in any day to day decision making.
The key takeaway is that the broad patterns we identified (i.e. the primary-secondary transition gap and the presence of inter-district movement at the secondary level) remain valid, though the exact scale and location of these patterns are less accurate. Some of these differences can be due to natural year-on-year variations or other data preparation factors such as the differences in geographic boundaries, rather than real changes in the underlying trends. I will continue reviewing these differences as more information becomes available, with the aim of ensuring that future analyses reflect the best evidence we have at the time.
More broadly, publishing this level of detailed enrolment data across multiple years would greatly improve our ability to track shifts in education patterns and identify where interventions are most needed. Without such data, we will have to rely on estimates which, while useful for signalling broad trends, can never be fully accurate.

Leave a Reply to SreeddaCancel reply