In a previous article, we explored when, where and why students drop out of school. We found that:
- When: Nationally, dropouts mostly occur between Form 3 and Form 4; however in Sarawak, dropouts are most significant between Primary 6 and Form 1
- Where: Both rural and urban districts see steep dropouts after Primary 6. Rural districts see large dropouts in percentage terms, urban districts see large dropouts in absolute terms. Both are equally important.
- Why: The reasons are complex. Both rural and urban children may face various socioeconomic pressures that impact their learning. However, a major factor that stands out is access. We spotted many primary schools with no secondary schools within reasonable distance, showing how inaccessible secondary schools can be.


So, where are schools most inaccessible? This article aims to provide a concrete picture of who is affected and where.
To do this, we will move beyond district level data and map out where people live at the level of individual communities. If we know where people live and where the schools are, then we can map the route taken to the nearest school. This tells us how people get to school, how long it takes to get there, and/or why they cannot get to school.
This will allow us to move on from broad generalisations to appreciating the local challenges that uniquely impact each community. We are also able to identify and bring attention to smaller, isolated communities which must be given equal importance.
In the rest of this article, I will introduce a methodology for estimating accessibility, explain the results, and make the data publicly available for future work.
Methodology
So, where do people live?
To estimate this, we use high-resolution population data published by WorldPop.org1, a project which estimates where people live using satellite imagery and machine learning models. WorldPop divides the world into 100m grids and predicts population counts based on features like buildings, night-time lights, infrastructure, and land cover. This is then calibrated against offficial census and UN data. (see full methodology here).
WorldPop’s work is extremely impressive, and they can capture population patterns in a way that we have not been able to before. Even so, estimates can be less accurate in rural areas where data is scarcer. Because this effects our analysis, we refine the data manually by checking locations against satellite imagery and adjusting population counts to match official census figures (see technical notes for more details).
A short recording showing how population points and school locations were validated against satellite imagery. This dashboard is accessible here and in the article below.
For this analysis, we therefore use a manually refined version of WorldPop, which is adjusted to match official data and other known sources. This is plotted below.
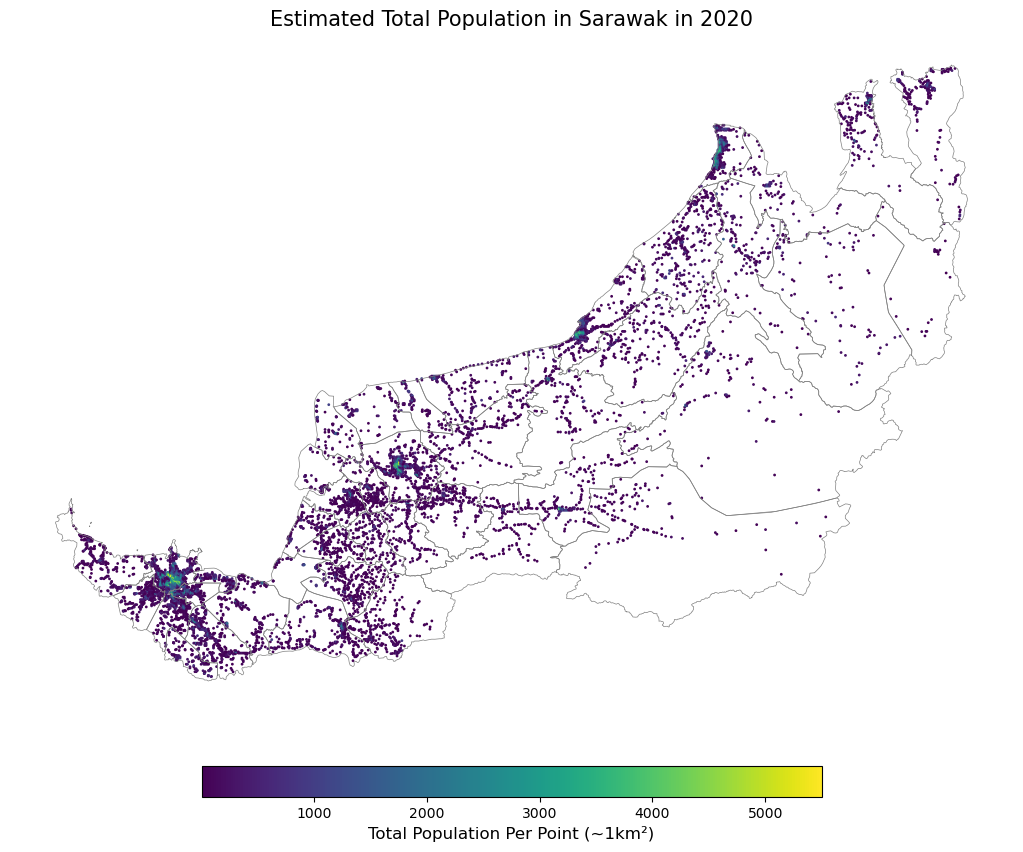
An interactive spatial dot plot of the estimated population in Sarawak (click on this link for a fullscreen version of this map).
This shows a more nuanced view on how population patterns vary across Sarawak. In urban districts (i.e. Kuching, Miri, Bintulu and Sibu), most people live near the city centre, but rural communities can still be found at the peripheries of these cities/towns. In rural districts, communities cluster around a township or along long stretches of roads and rivers. Generally, as we move inland from the coast, the terrain becomes more challenging and populations become more dispersed.
Where are the schools?
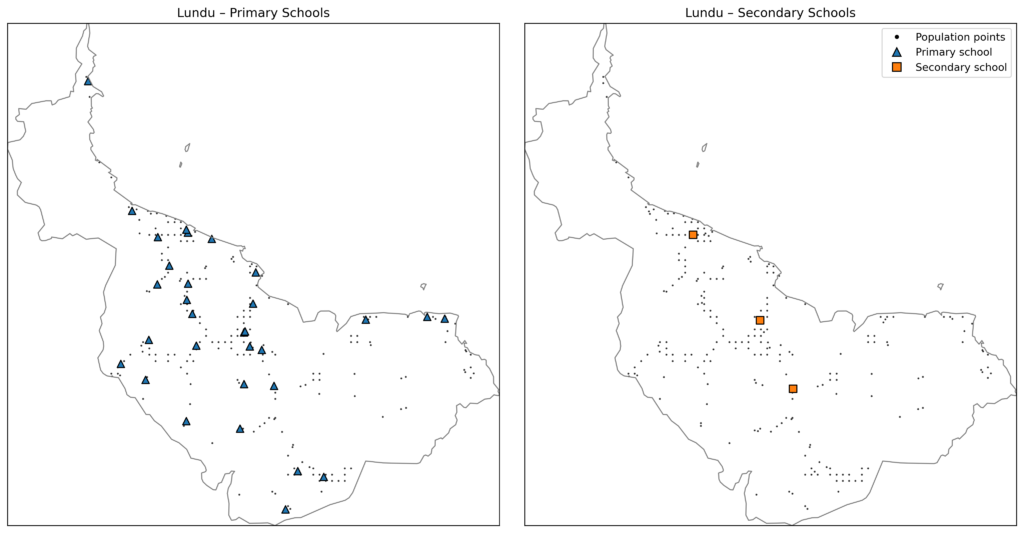
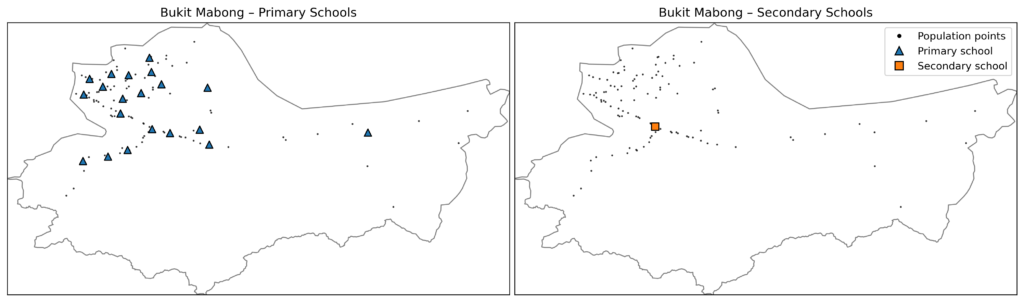
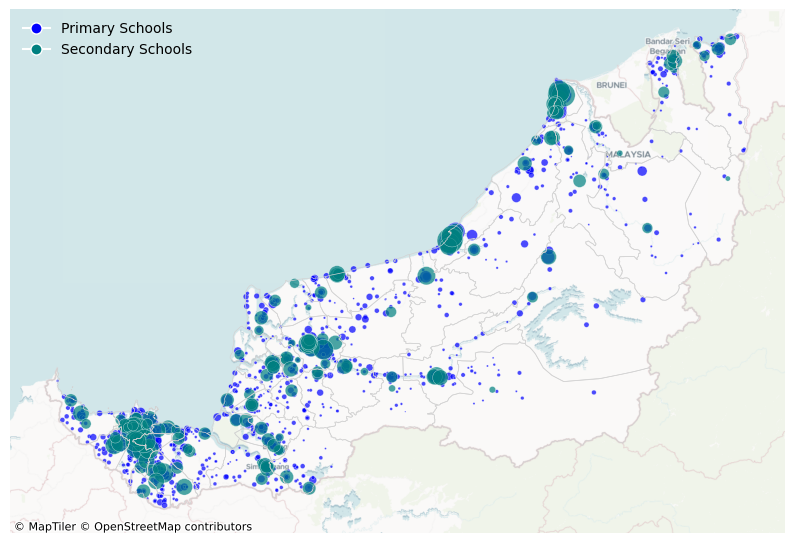
The locations of the 1,280 primary and 220 secondary schools is plotted below.
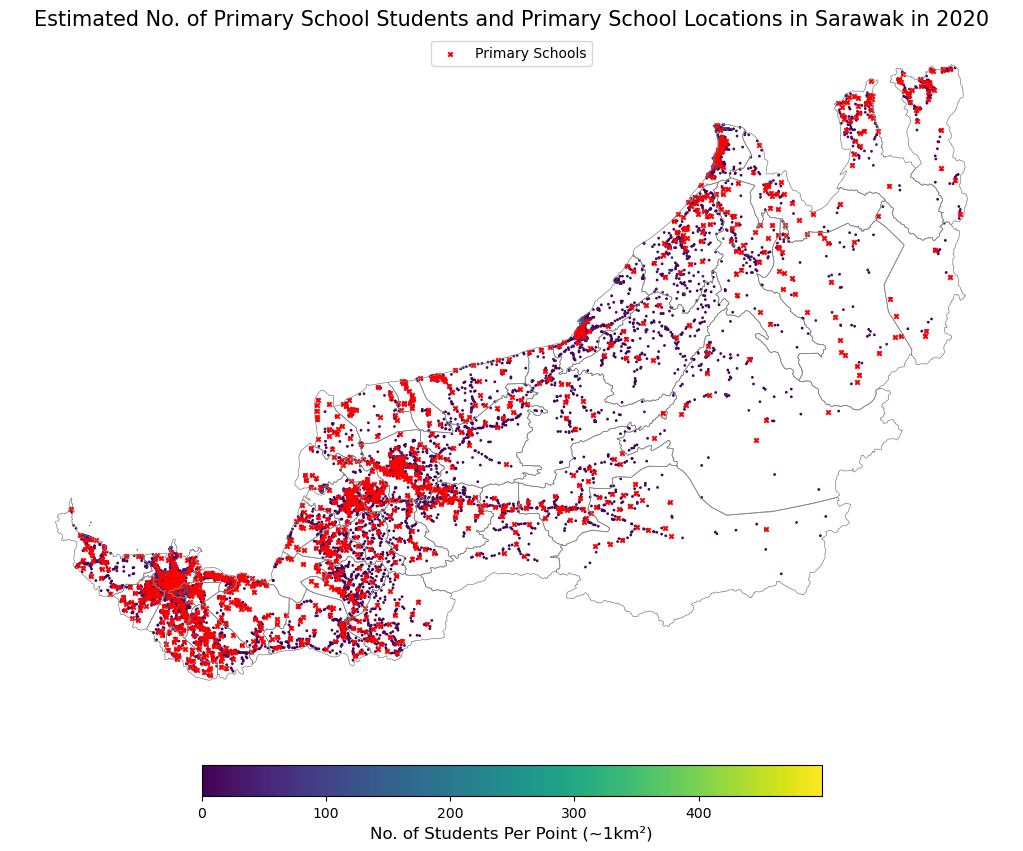
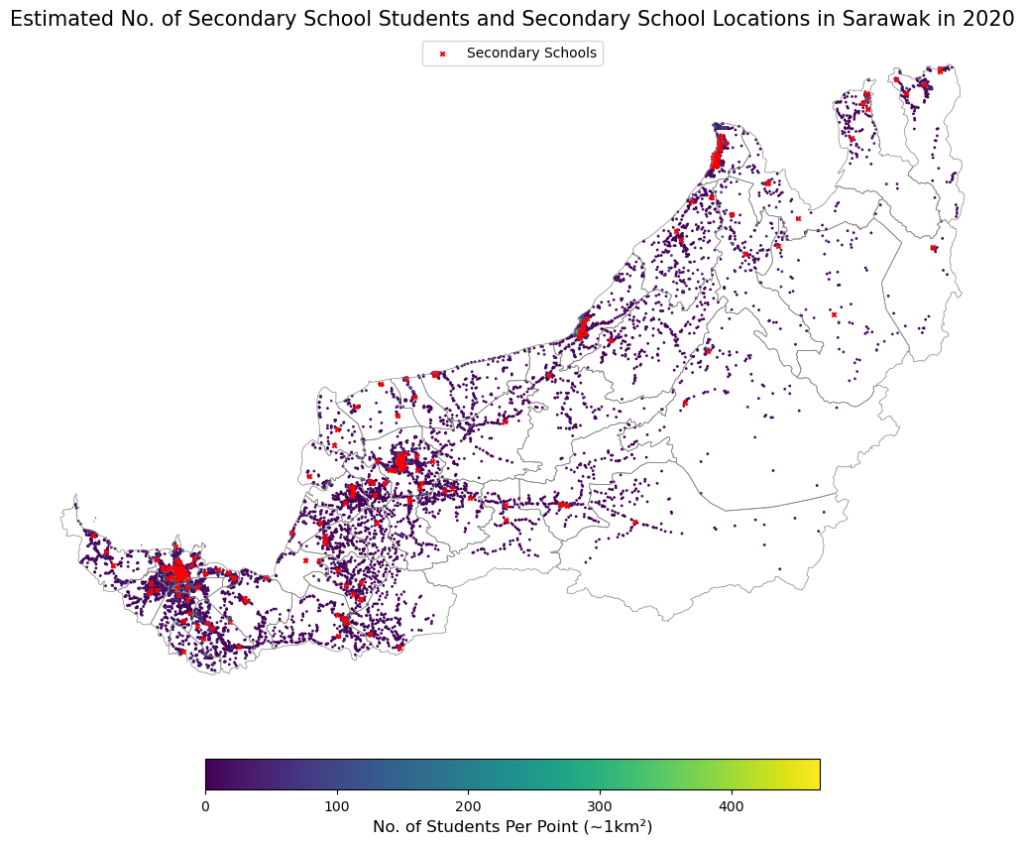
An interactive spatial dot plot of the estimated population in Sarawak (click on this link for a fullscreen version of this map).
Not only do we see that secondary schools are generally less accessible, we also see how certain communities can be far from both primary and secondary schools.
How do people get to school?
To understand travel patterns, we adapt a methodology based on the World Bank’s Rural Accessibility Map Project2. For every population point, we find the shortest path to the nearest school. Instead of using the straight-line (euclidean) distance, we calculate the actual path travel path required. The difference is illustrated below.
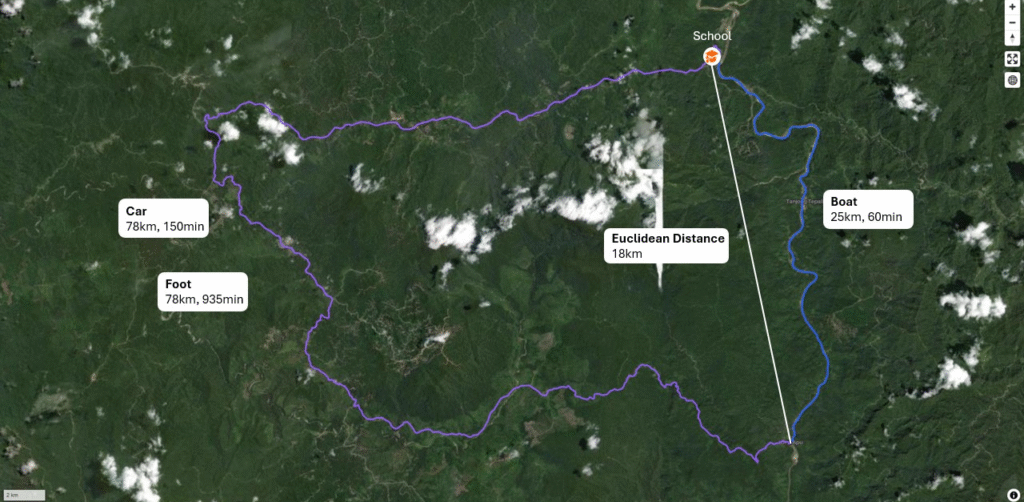
This distinction is important because it shows ‘accessibility blind spots.’ These are places that appear close to each other, but are actually disconnected due to the terrain or lack of infrastructure. It also allows us to observe the travel paths required to get to school. For example, the use of footpaths, off-road, and river routes.
Potential foot, car and boat routes were calculated using the Open Source Routing Machine (OSRM), an open-source equivalent to Google Maps / Apple Maps / Waze.
Results
How do people get to school?
Using the foot, car, and boat routes for each population point, we identify the most likely travel mode. Walking is assumed when a school is within 1 km; car routes are preferred where possible; and boats are used when it is significantly faster (more than 20 mins faster) or it is the only route available. This is done for both primary and secondary schools.
This classification does not mean that there are no alternative route choices. For example, communities in a ‘car’ area may still walk for cost or convenience reasons. Rather, this classification reflects the option that is generally fastest or most practical.
Based on this, points are classified into communities that rely on car, foot, or boat, with an additional no route category for communities where no routes were detected.
Full route calculations provided on GitHub, with the combined plot shown below.
Primary School
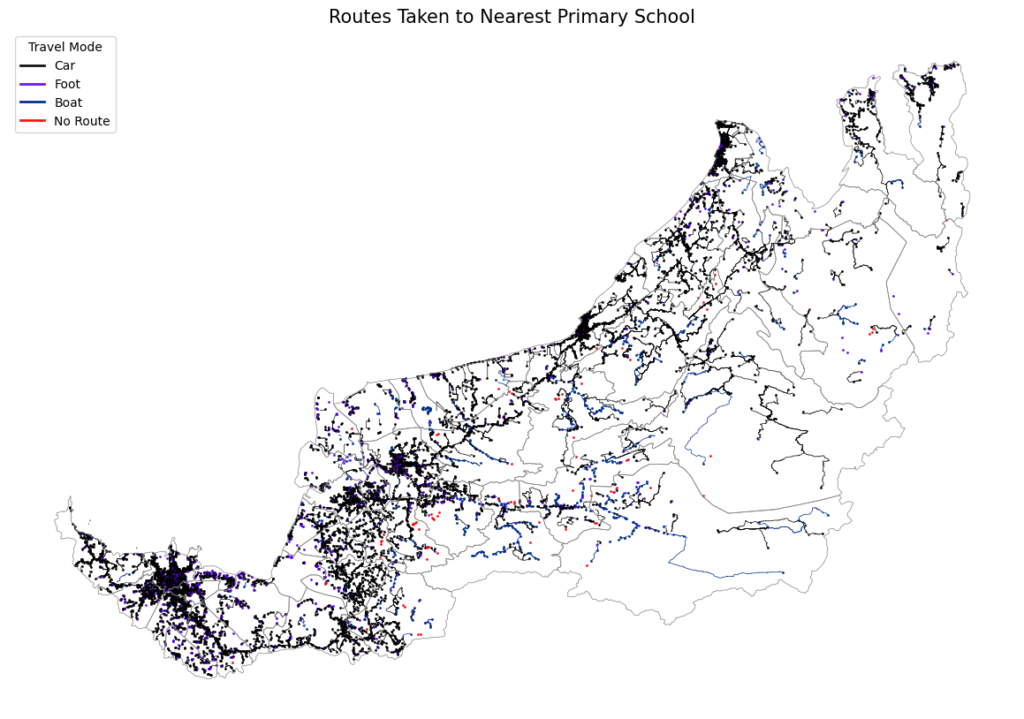
An interactive plot of the routes taken to the primary school (best viewed on laptop; due to large file size, this may take a few seconds to load; click on this link for a full screen version of this map).
Secondary School
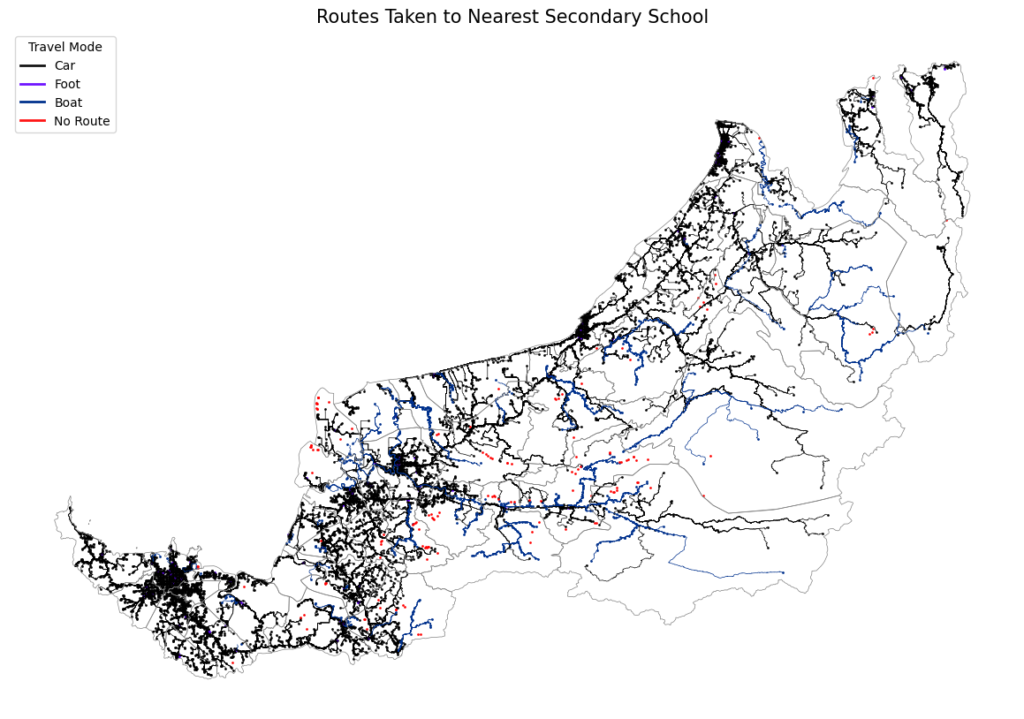
An interactive plot of the routes taken to the secondary school (best viewed on laptop; due to large file size, this may take a few seconds to load; click on this link for a full screen version of this map).
The accessibility gap between primary and secondary schools
There is a significant accessibility gap between primary and secondary schools in Sarawak, largely due to how the school network is organised.
Primary schools are widely distributed and located close to kampungs, longhouses, and small townships. In contrast, secondary schools are far more centralised, typically located at town centres that serve much larger catchment areas. With about ~1,280 primary schools but only about ~220 secondary schools, many students are inevitably funnelled into these centralised locations that are far from home.
To some extent, this centralisation is partly unavoidable. Secondary schools require subject-specific facilities (i.e. labs, bengkel) and subject-specific teachers, all of which are difficult to provide in a highly distributed manner. Even so, this structure has a real impact on how far children must travel and their ability to attend school. Some examples are shown below.
To understand this gap, let’s first look at how we can measure travel times and inequality within a district
There are two questions that we care about:
- How long does it take for a typical student to get to school?
- Are there large inequalities in that district?
We can answer these with two simple indicators:
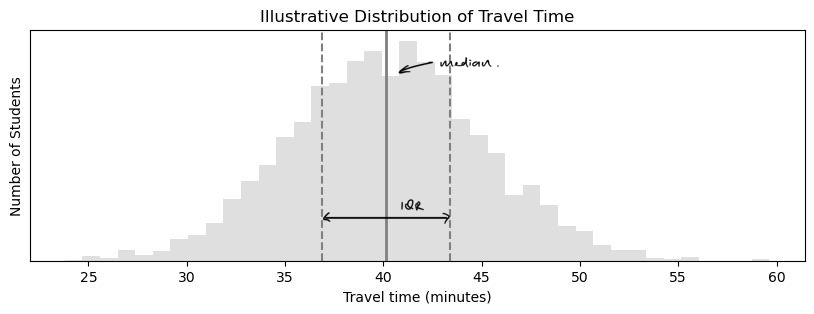
- Typical travel time – median:
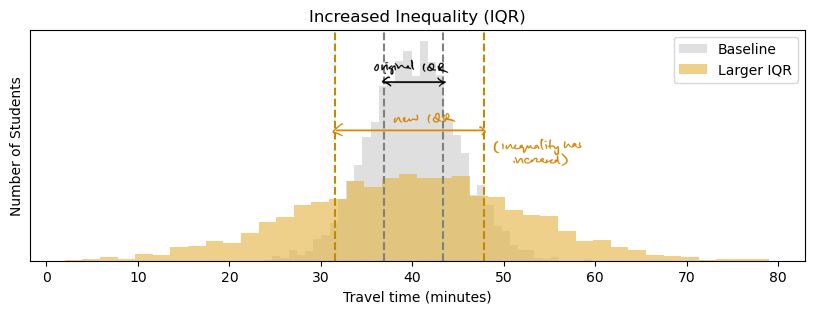
This is the travel time experienced by the student right in the middle of the population, a reflection of a ‘typical’ student experience. - Inequality – interquartile range (IQR):
This is the difference between students who live relatively near (25th percentile) and those much further away (75th percentile). A larger gap means greater inequality.
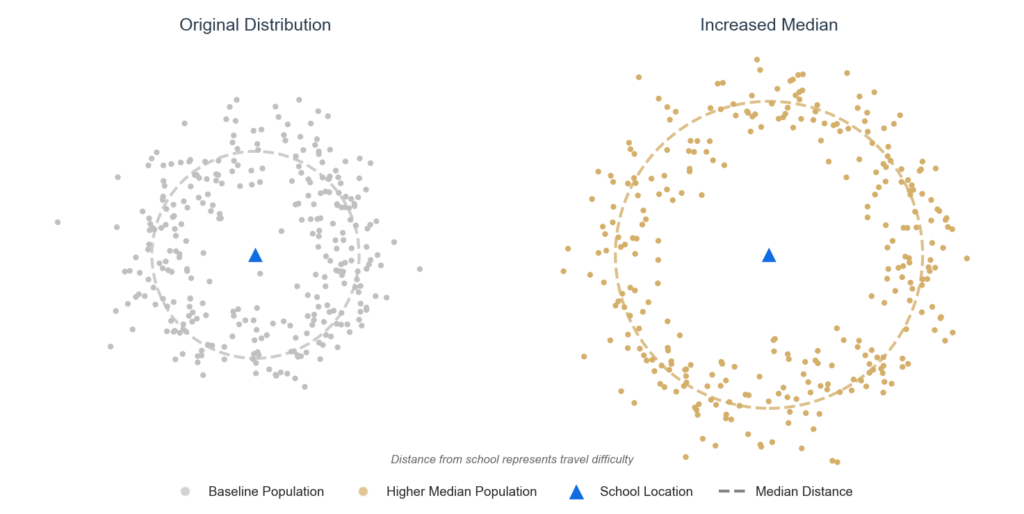
To show what these indicators mean, let’s plot an illustrative number of students and their travel times on the same graph.
A higher median means that the travel time for the typical student has increased.
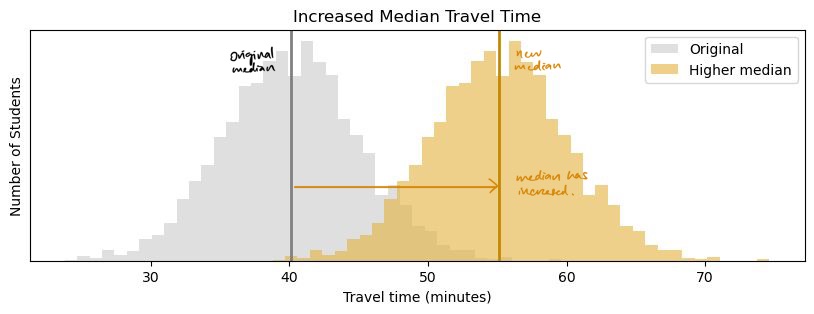
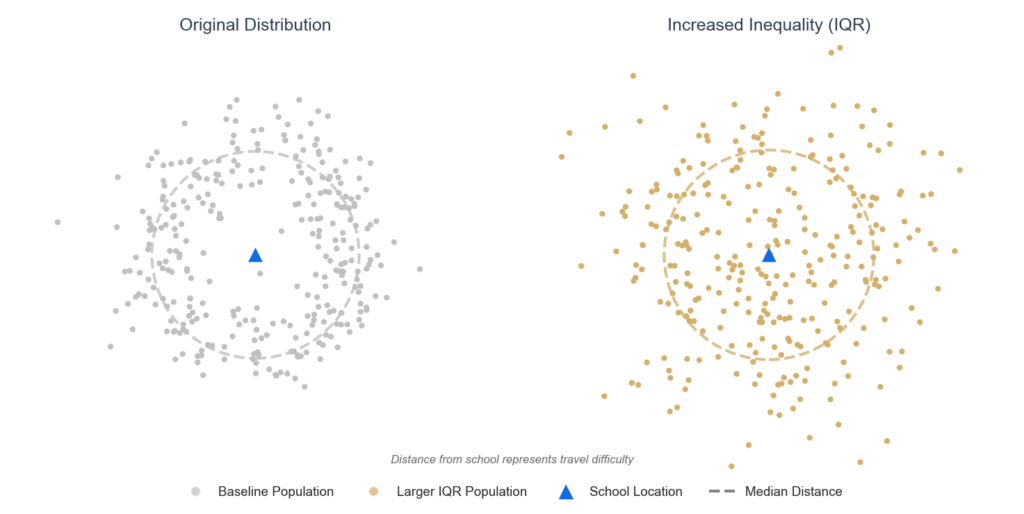
A higher interquartile range means that some students are traveling much farther compared to most of the population, which shows high inequality.
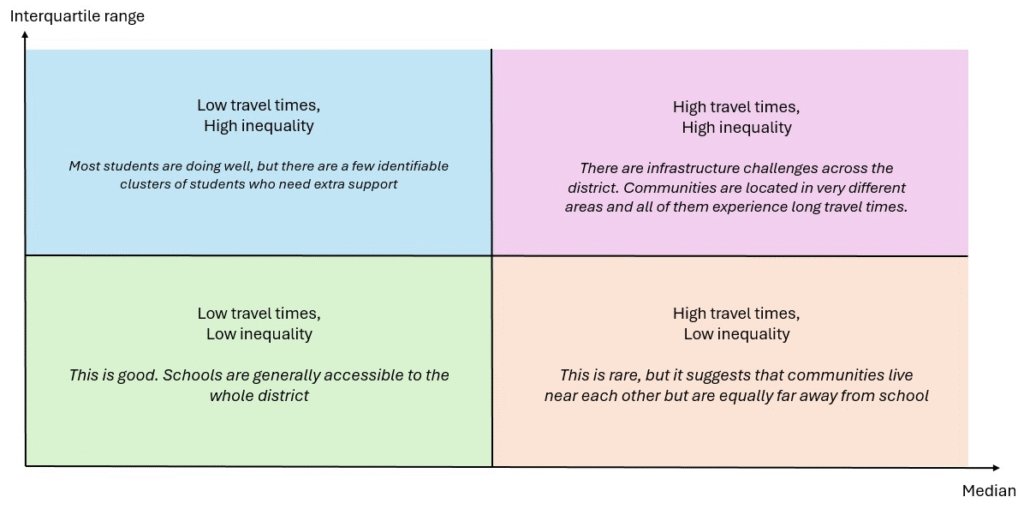
Together, we can use these indicators to sort districts into four broad types, highlighting the different accessibility challenges they face.
Between primary and secondary school, both travel times and inequality within districts increase
Here, we plot the median and interquartile range of travel times in all 40 districts for both primary and secondary school students.
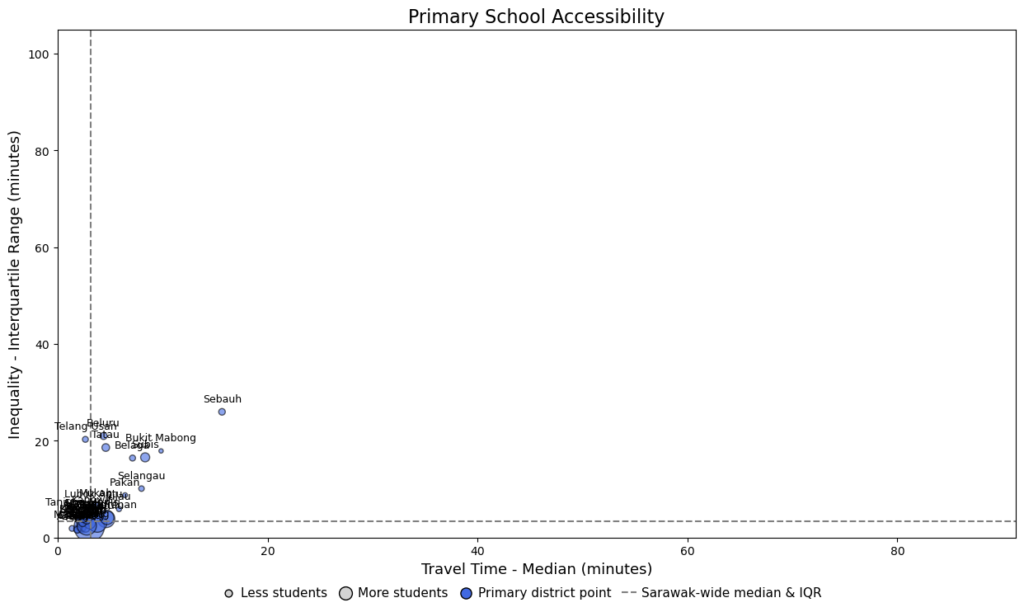
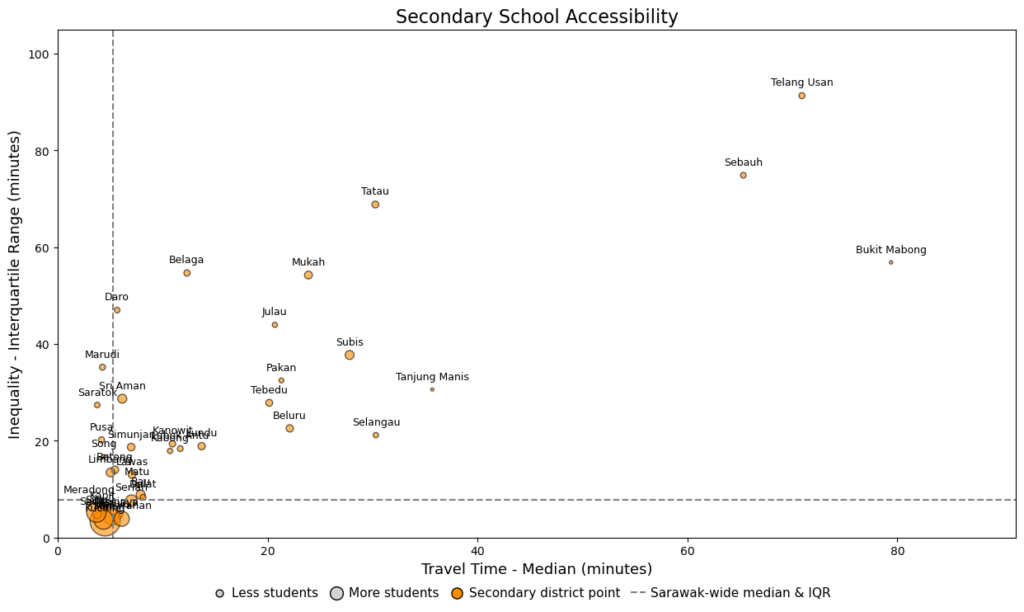
Across almost all districts, both travel times and inequality increases between primary and secondary schools. The largest increases are seen in Telang Usan, Bukit Mabong and Sebauh. Median travel times increase by up to 70 mins, while the interquartile range widens by up to 70 mins.
As a result, several districts shift into the low travel time, high inequality category, while many more move into the high travel time, high inequality category. The implications of these shifts are discussed in more detail in the discussion section below.
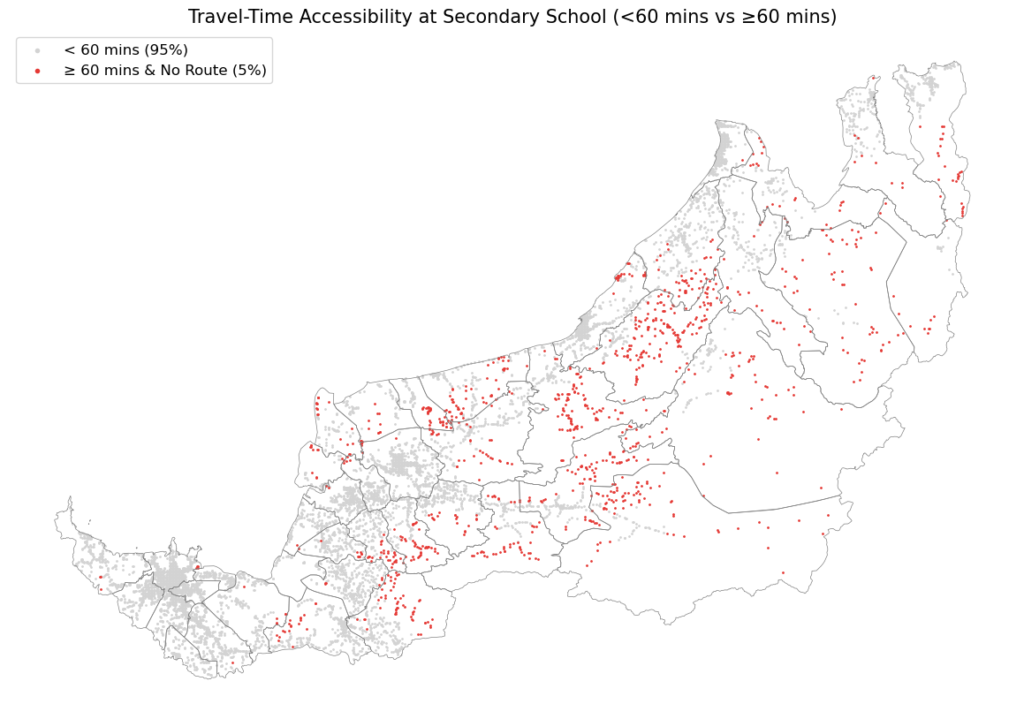
The number of students without viable routes increases from 1% to 5% between primary and secondary school
Lets now shift our attention to the specific communities without viable routes to school. There are two main groups of concern: students with no detectable route to school, and students facing unrealistic travel times. For the purpose of this analysis, let us consider that routes more than 60 mins3 one-way to the only nearest school is an unrealistic travel time (that’s more than 2 hours two-ways); these are students who are technically connected but unlikely to be able to commute.
These two groups are plotted in the donut chart and interactive maps below.
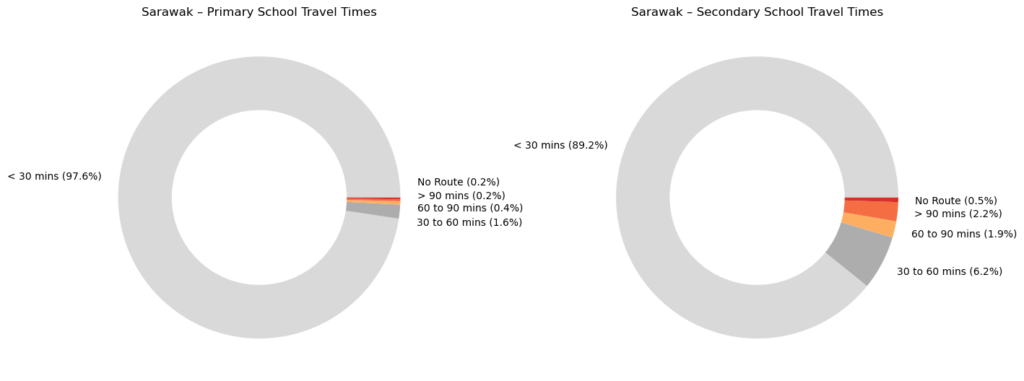
An interactive plot of the change in travel times in primary school and secondary school (click on links for a full-screen version of this map).
The share of students with no possible routes to school increases from 0.2% to 0.5% between primary and secondary school. While this may appear small in percentage terms, it represents ~1,500 total students living in communities that are effectively isolated, with no detectable pedestrian, boat, or car routes to the nearest school.
When students facing unrealistic travel times are grouped together, the scale of exclusion is even more pronounced. Combining both groups, about 1% of primary school students and 5% of secondary school students are effectively cut off from regular school access. Together, this accounts for a sizeable ~11,000 students.
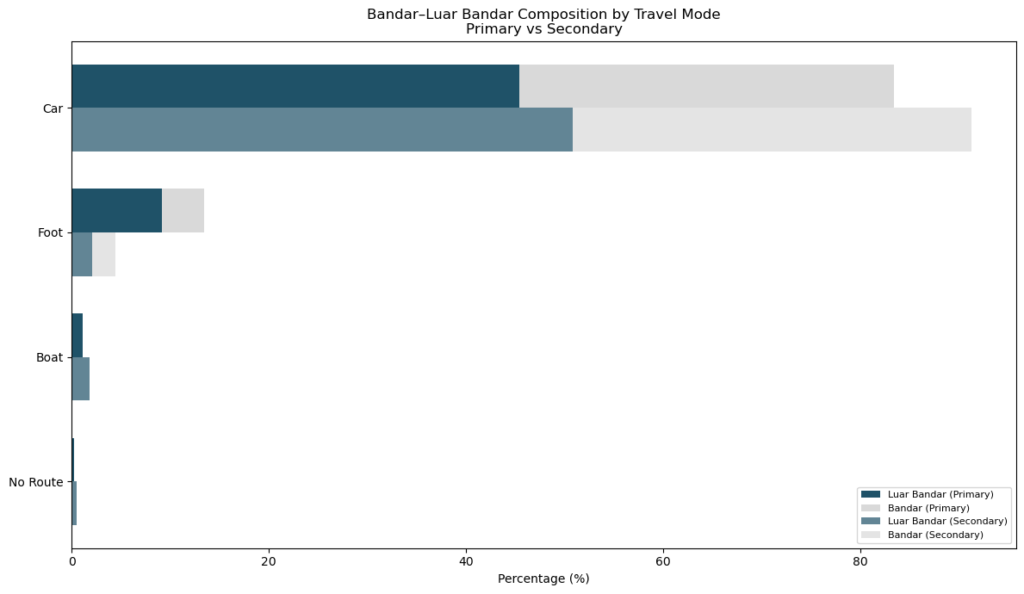
The mode of travel shifts from foot to off-road cars and boats, especially in rural areas
Beyond longer travel times, accessibility also worsens because the required transport modes change between primary and secondary school.
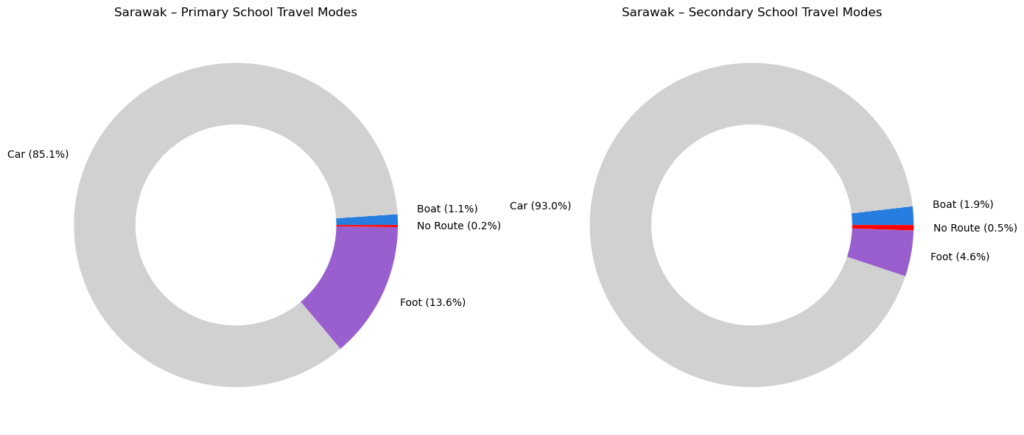
Overall in Sarawak, foot travel reduces from 13.6% to 4.6% between primary and secondary school. This reduction in foot travel translates to an increase in car travel (85.1% to 93.0%), boat travel (1.1% to 1.9%) and students with no detected routes.
In other words, schools are no longer within walking distance; students rely more on cars and boats to get to secondary schools.
The reduction in foot travel occurs in both urban and rural areas, but they both experience this change differently. In urban areas, although the schools are further, communities are usually still well connected and within reasonable distance. In luar-bandar areas, not only are the schools further, the ability to travel there is limited. Students have to rely on boats, and if a car route is available, it is generally off-road.
An interactive plot of the change in travel mode between primary and secondary schools for each population point (click on this link for a full-screen version of this map).
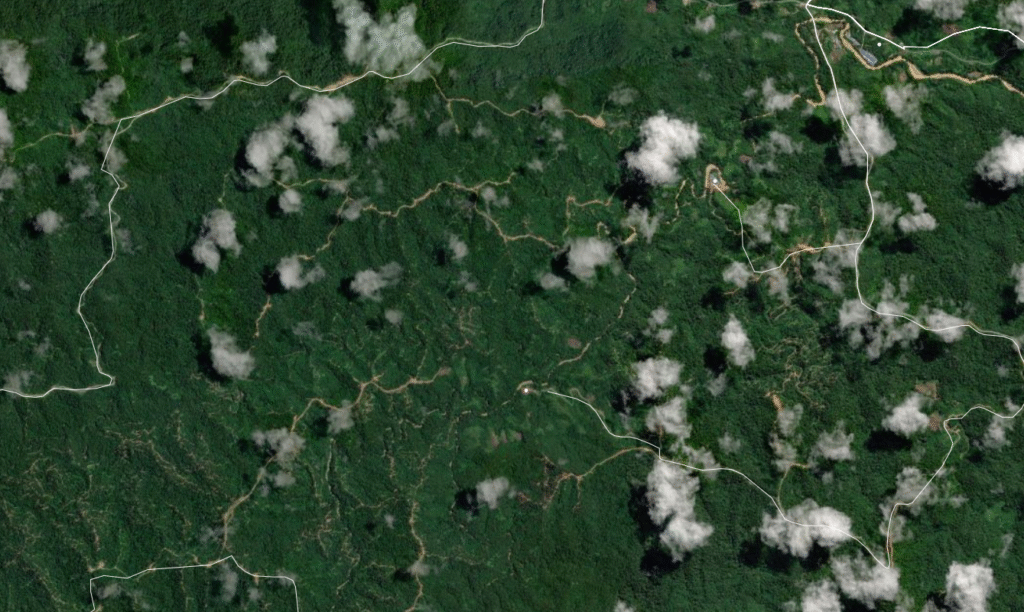
An example of a rural community that relies on off-road routes is shown below. These routes are informal paths used by local communities to walk or drive in the absence of paved roads. In some cases, they follow former logging roads and are therefore very common near large plantations; in others, they are informal pathways that have emerged through repeated use over time. While we are currently unable to map these off-road routes in detail due to data limitations, they are an important feature to recognise, particularly in the hinterland areas of Sarawak.
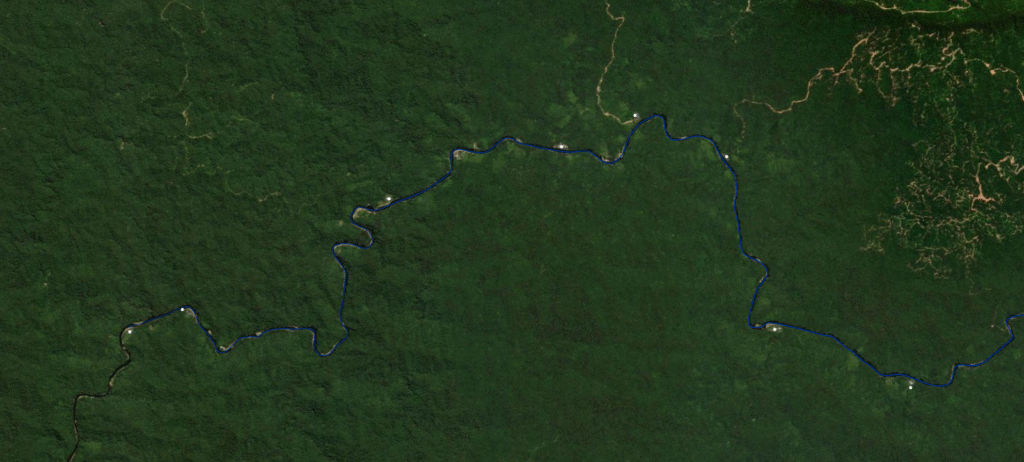
On the other hand, an example of a rural community that relies on boat routes is shown below. This analysis estimates that around 1.1% of primary school students and 1.8% of secondary school students are likely to depend on boat travel. Although these percentages may appear small, together they still account for ~6,200 students. Of these, around ~3,600 students have no alternatives to boat routes, not even off-road unpaved routes.
Discussion
The final 5% is the most important 5%
The first 95% of the population are concentrated in known cities and townships. The remaining 5% is spread out across a wide range of geographies and circumstances. This 5% is more difficult to reach than the first 95%: they face highly localised challenges and do not benefit from economies of scale.
A key objective of this granular analysis is to understand what it means to be in this 5%. These communities may be small in numbers, but that does not mean they are any less important. If anything, the remoteness of these communities makes it even more important to understand their specific contexts. Many people here do not have reliable access to public infrastructure, and there is very little public information available documenting these challenges. This makes them both the most urgent group to support yet the easiest to overlook at the same time.
I therefore started this analysis by examining each community individually, before stepping back to summarise key observations and examples at the state-wide level. Now that you have read the summary, I highly encourage returning to the granular view, especially for communities of special interest to you. These challenges are not new, but seeing them mapped in concrete terms can help us appreciate the scale, nuance, and what solutions are possible.
The nature of accessibility challenges varies between districts, therefore solutions also vary
While I do not wish to oversimplify the varying challenges across districts, the broad archetypes introduced earlier on remain useful as a way to distinguish between different types of problems and to think systematically about appropriate responses.
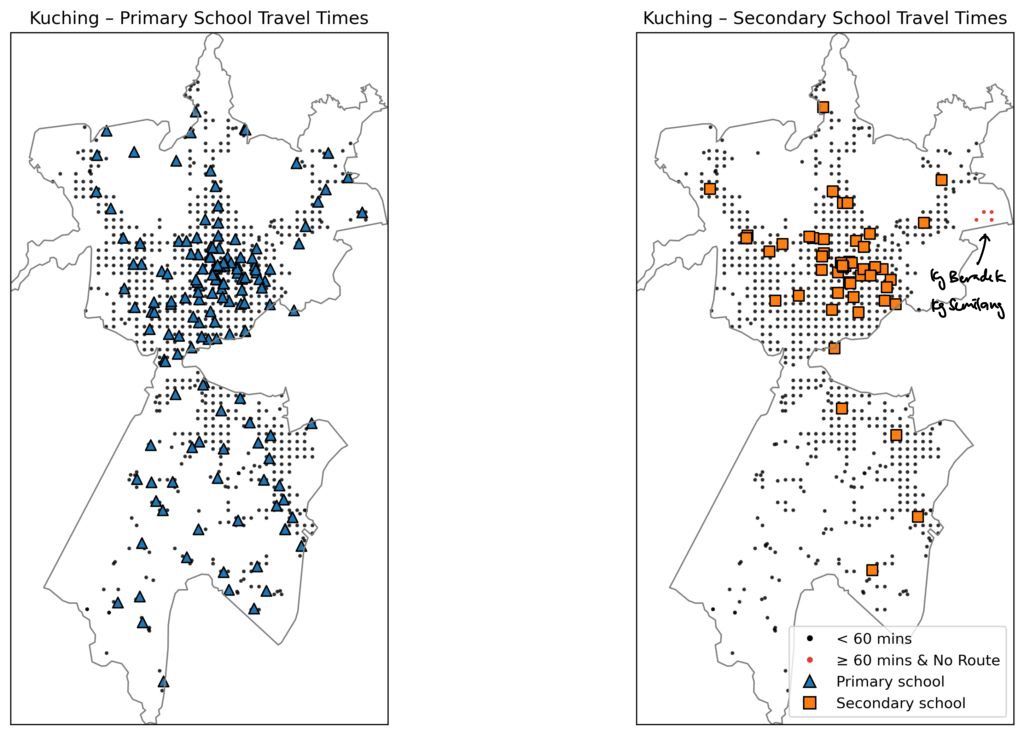
Kuching is an example of a district characterised by low travel times and low inequality. Most students are already well connected to schools, and physical access is unlikely to be a major driver of school dropouts. In such contexts, differences in educational outcomes are more likely to be explained by socioeconomic factors rather than infrastructure gaps. Targeted socio-economic support (e.g. subsidies or social assistance) are likely to be more effective than large-scale infrastructure upgrades.
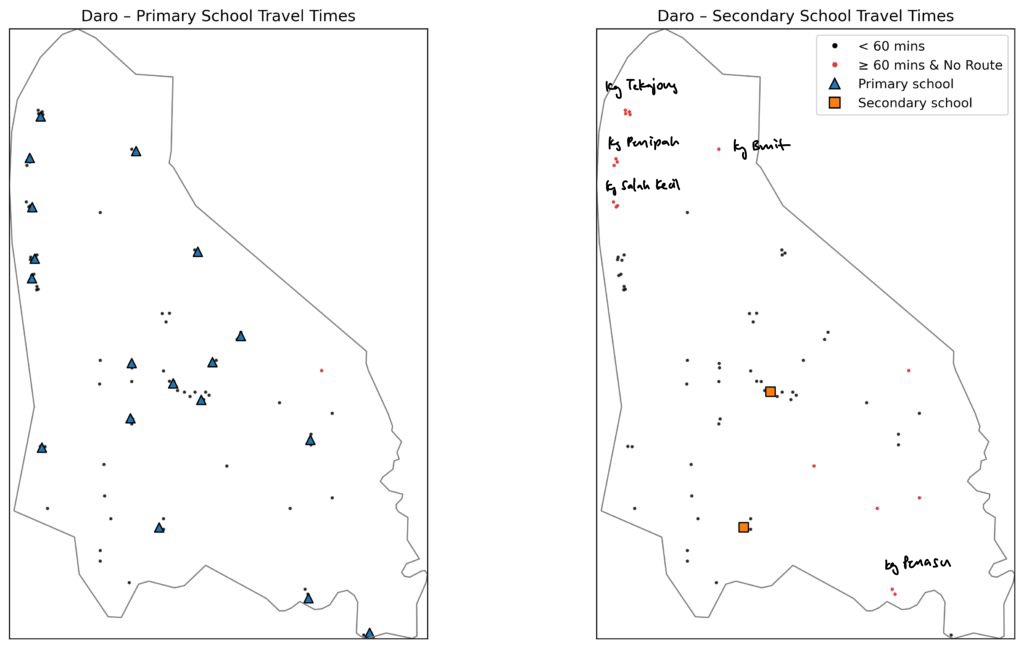
In contrast, Daro illustrates a low travel time, high inequality case. While most of the population is well connected, specific communities (i.e. Kampung Tekajong, Kampung Penipah, Kampung Salah Kecil Kampung Bruit and Kampung Penasu) remain disconnected from secondary schools. Here, the challenge is not district-wide access, but identifying and supporting a relatively small yet highly vulnerable group through targeted interventions.
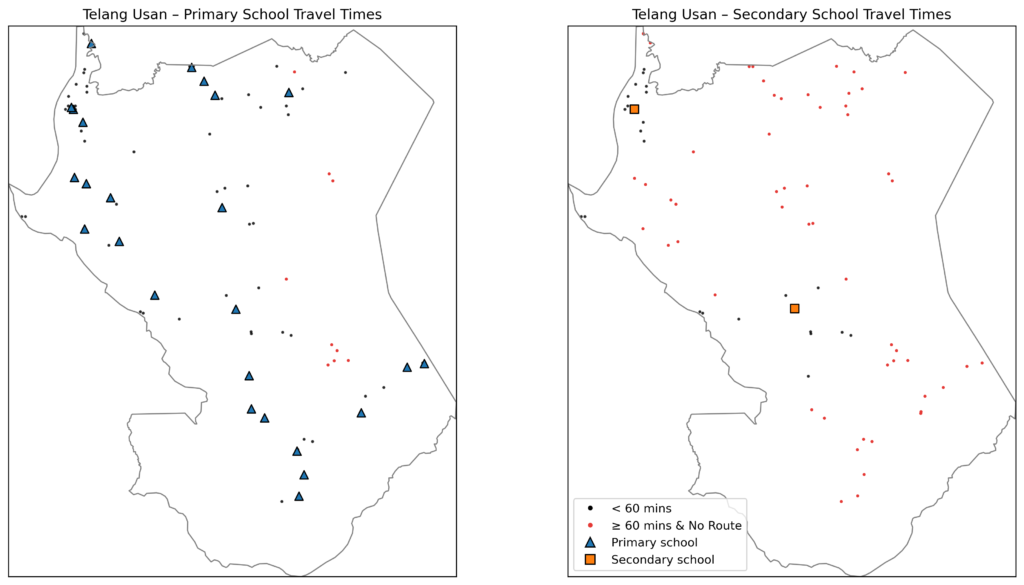
Telang Usan illustrates a high travel time, high inequality district. Students are dispersed across multiple remote locations, and all of them face long journeys to school. These challenges cannot be addressed through temporary measures. Instead, they require structural solutions such as building additional schools, improving road connectivity, and/or strengthening river transport networks.
These districts are highlighted because they illustrate the archetypes most clearly. In practice, however, most districts fall along a spectrum rather than fitting neatly into fixed categories. Moreover, district-level indicators can mask important within-district differences. Even in well-performing districts like Kuching, there are still pockets of inaccessibility (i.e. Kampung Beradek and Kampung Semilang) that can be obscured when results are aggregated at the district level.
Even so, these groupings remain a useful starting point for understanding the broad nature of accessibility challenges and for enabling relative comparisons across districts.
The key takeaway here is that similar travel times can reflect very different underlying problems, and therefore call for fundamentally different responses.
Infrastructure upgrades are needed urgently
Looking beyond district-wide summaries, what kind of infrastructure upgrades are required and where?
Upgrading access to existing schools
The first priority is improving access to existing schools. Without reliable road or river connectivity, students cannot reach school in practice, regardless of subsidies, incentives, or behavioural interventions.
Based on the earlier analysis, students who face the greatest barriers fall into three broad groups. Their locations have been discussed extensively so I do not wish to repeat them here. Instead, the focus is on what each category implies in practice.
- No viable routes
These students are effectively disconnected. There are no detectable foot, boat, or car routes. In such cases, financial or behavioural support is ineffective because there is no route to subsidise or incentivise. The only viable response is to create physical access by building new transport routes. - Reliance on boats or unpaved routes
These students are technically connected, but access depends on slow, costly, or weather-dependent modes such as river transport4 or low-quality roads. Here, the constraint is route quality rather than distance. Targeted upgrades to existing routes can materially reduce travel times and improve reliability. - Connected but impractical travel times
In some communities, routes exist but distances are too large for daily travel to be realistic. In these cases, further route upgrades alone are not enough. Either new (shorter) routes need to be created, new schools need to be built, or students will have to rely on boarding school arrangements.
Basic infrastructure alone is not enough to resolve all accessibility challenges, as rural students also face a wide range of other socio-economic barriers. However, reliable transport connectivity is a necessary pre-condition for most forms of intervention to work. With connectivity in place, additional measures can then reduce remaining barriers. For example, in communities where transport costs are disproportionately high, targeted subsidies can help offset these expenses. This could include extending the federal BUDI95 programme to cover school-related fuel use, or expanding the state-led Free Water Transportation Programme for School Students, effectively a boat-based equivalent of a public school bus.
There are many other measures that we can discuss, but none will be any helpful unless connectivity is addressed first.
Improving quality of existing schools
Besides that, improving access must go hand in hand with improving school quality. Connectivity gains alone will not translate into better educational outcomes if the schools that students can reach are under-resourced.
One visible indicator of quality is the prevalence of dilapidated schools (sekolah daif)5‘6. As of 2024, 555 schools in Sarawak (around one third of all schools) are classified as dilapidated. Of these, 361 require major repairs and 194 require complete rebuilding (Source: FMT). Yet, only 1157 schools have funding approved for upgrades and are currently in construction or pre-construction stages (Source: MOE). These are plotted below.
An interactive plot of the 115 dilapidated schools with funding approved, for in primary school and secondary school and populations that are nearest to this school (click on links for a full-screen version of this map).
While there are more dilapidated primary schools, the smaller number of secondary schools serve much wider catchment areas, especially in rural areas. In these contexts, a single school often supports large and geographically dispersed populations. When such a school becomes unsafe or partially non-functional, students do not have the option to go elsewhere; they are effectively pushed out of the system.
It is also important to note that publicly available data cover only schools with approved funding for upgrades. The condition of the remaining ~400 dilapidated schools is not publicly documented, suggesting that the true scale of the problem is understated.
Beyond dilapidated schools, having structurally safe schools is only the bare minimum for a conducive learning environment. Many rural schools also face widely documented challenges. For example, teacher shortages, limited learning resources (e.g. ICT access or science labs), and limited curriculum (e.g. some schools do not offer all subjects, and some schools only offer classes up to Form 3).
These factors are not quantified here due to data limitations, but their implications are clear. Where access is already limited and there is a lack of alternatives, such deficiencies have disproportionately large effects, further limiting the ability of students to attend school.
Primary schools can play an important role in the primary-secondary transition gap
Despite the significant challenges faced by rural communities, there is one important positive observation. While the gap between primary and secondary school remains large, primary school enrolment in Sarawak is almost universal at 96% (author’s calculations). Indeed, a closer look at the maps will show that primary schools have been built even in the most remote corners of Sarawak, even if just to serve one or two kampungs or longhouses.
This matters because it means that these children are visible to us. Unlike many vulnerable groups whose challenges are often invisible, these students are at least visible through the education system. It is just that when these children grow to reach secondary schools age, they become ‘invisible’ again by being out of reach from secondary schools.
This creates an opportunity to reach these students at an earlier stage of life via primary schools. By identifying students who face unrealistic travel times to secondary schools (>60 mins) and tracing them back to the primary schools they are most likely to attend, we can identify where the primary-secondary transition is most at risk. Intervening at the primary school level rather than waiting until students drop out at secondary school age is a more effective way to close this transition gap.
An interactive map showing student flows between primary and secondary schools, coloured by the risk level of the primary school based on how many of its students are likely to be cut-off from secondary schools. Students are considered ‘cut-off’ if their travel time to the nearest secondary school is more than 60 mins or no route exists. Primary schools categorised into low risk (where all studens can reach a secondary school within 60 mins), medium risk (where up to 30% of students are cut-off) and high risk (where more than 30% of students are likely cut-off from secondary school access). Click on this link for a full-screen version of this map.
This is important to note because the role of primary schools is often overlooked in the discussion of education inequality. The assumption is that primary school enrolment is already almost universal, so more attention is given to encouraging secondary school and tertiary education students to pursue further education. The reality in Sarawak is that the largest drop-off occurs at the primary-secondary transition rather than at later stages (author’s calculations).
From this lens, primary schools can play an important role in improving secondary school outcomes. Beyond large-scale structural solutions such as transport and infrastructure upgrades, primary schools are well placed to support students and families in more personal ways. For example, guiding families through the application process, identifying at-risk students early, and directing them towards existing support schemes. Where support schemes do not currently exist, primary schools are also a valuable source of local knowledge, given that they have long been embedded within these communities.
That said, primary schools cannot do this on their own. Their effectiveness depends on enough resourcing (especially as these primary schools also tend to be under-resourced) and parallel improvements in transport and infrastructure. The key point, however, is that if we recognise that education disparities in Sarawak largely emerge before secondary school, then earlier, primary-school-based, interventions are likely to be more effective; therefore primary schools should be recognised and empowered as an important part of the solution.
Limitations
First, it is important to note that there are limits to granulation population data modelling. Machine learning models like WorldPop are designed to fill gaps only where official data is not publicly available. They are useful in understanding patterns, but are not necessarily accurate enough for day-to-day operations. While every effort is made to ensure that the data is as representative as possible, any estimate can carry unintended biases, whether from the model, the method or the individual researcher. These estimates can show us where to look, hopefully in places that were invisible before. However, wherever possible, decisions should rely on detailed internal datasets (which may not be published publicly for privacy reasons) or through verification on the ground.
Second, this analysis measures accessibility based on the nearest school, but the reality is more complex. Some students have access to boarding schools, and others do not. Some have access to shared transport (public transport or private options), and others do not. Some routes are theoretically possible but impractical in reality (i.e. they are poorly maintained or closed off). All these reasons can mean that even among those who are disadvantaged, there are some who are more severely impacted than others.
Third, this project relies heavily on public infrastructure data from OpenStreetMap (OSM), which can be incomplete in rural areas. There may be newer roads that are not updated. Many rural features also lack key metadata; for example, whether roads are paved or unpaved and whether rivers are usable for boats or not. While OSM data can be improved through crowdsourcing, researchers are also increasingly using machine-learning methods to fill data gaps8. These advances could significantly expand the scope and depth of analyses like this.
Last but not least, although I have tried to make the data as representative as possible, this analysis is still shaped and limited by my own perspective. There are many more teachers, community workers, and locals who can add far more depth. My hope in preparing and sharing this dataset publicly is so that many more people can weigh in from different perspectives. In doing so, we can build a more complete picture of what is happening on the ground.
Future Work
That said, granular population data and accessibility analysis can be useful for understanding a wide range of socio-economic challenges beyond just schools. The same approach can help us understand gaps in many essential services and infrastructure. For example, access to healthcare (clinics and hospitals), digital access, water, electricity, finance (e.g. how many rural areas actually have an ATM), or even basic needs like fuel (e.g. where is the nearest petrol station).
It can also help us understand structural barriers in accessing economic opportunities. For example, access to a market (pasar), access to job opportunities, or even access to loans (i.e. a bank branch) to start an SME.
Granular population data is also helpful in understanding risks. It can be used to identify populations that are vulnerable to natural disasters, infectious diseases, and long-term extreme climate change risks.
None of these issues are new, but we can do much more to understand what they mean in practice. By preparing this detailed data and demonstrating a repeatable methodology, my hope is that more people can use this to further our understanding on these many challenges, and to address them; in Sarawak and other parts of Malaysia.
Conclusion
(In)accessibility of schools remains an important reason for the large gap between primary and secondary enrolment in Sarawak. In this article, we explore this challenge in detail by mapping where individual communities live and the most likely routes they need to take to get to the nearest school. This approach allows us to move beyond district averages and identify the specific infrastructure and geographic constraints faced by different groups of students.
A key difference between primary and secondary schools is where the schools are located. Primary schools tend to be widely distributed, typically located close to kampungs or longhouses. In contrast, secondary schools are far more centralised, typically clustered in towns or cities and serving much wider catchment areas. As a result, both travel times and inequality increases sharply at the secondary school level. Not only does the number of students cut off from regular school access increases, but schools also become less walkable, meaning that rural students have to rely on boats and unpaved routes to get to school.
By the time students reach secondary school, roughly 5% (~11,000) of students in Sarawak are cut off from regular school access. This 5% is more difficult to reach than the first 95%; they face highly localised challenges, do not benefit from economies of scale, and are easily overlooked in district-wide or national statistics. Without granular analysis, their challenges are often invisible.
How can we address these gaps? The first step is to properly diagnose the challenge. Despite similar travel times, different districts can face very different challenges. In districts with low median travel times but high inequality, most students have good access, but there are pockets of vulnerable communities that can benefit from targeted, localised support. In districts with both high travel times and high inequality, many communities live in different areas and they are all far away from schools; only large-scale infrastructure upgrades such as new routes or schools can be helpful here.
Across all these cases, basic infrastructure upgrades remain urgently needed. This includes upgrading connections to existing schools, improving the quality of existing schools, and building new schools in areas where schools remain unrealistically far despite connectivity upgrades. This is especially important in rural Sarawak where students typically have no alternative schools. A failure in either of these aspects means that students have no where else to go; they are simply pushed out of the schooling system. These failure points therefore carry far greater consequences in rural areas than in urban or semi-urban settings.
Alongside structural upgrades, many students also face socio-economic barriers that increase the risk of early dropouts, especially during the primary-secondary school transition. In this context, primary schools (if adequately resourced and empowered) can play a crucial role. They are well placed to identify students at risk from an early stage, connect families to support programmes, and are a valuable source of local knowledge, given that they have long been embedded in their communities.
We have discussed all of these and more through various detailed maps in this article. My hope is that it helps make visible the specific and often overlooked challenges by some of Sarawak (and Malaysia)’s most isolated communities. As I wrote in my first article on education, I am repeatedly reminded of how fortunate I have been to have had access to a good education and to have good teachers in my life. This is the little I can do to raise awareness, in hopes that we find ways to make sure that all children can have that too.
References
- Bondarenko M., Kerr D., Sorichetta A., and Tatem, A.J. 2020. Estimates of 2020 total number of people per grid square, adjusted to match the corresponding UNPD 2020 estimates and broken down by gender and age groupings, produced using Built-Settlement Growth Model (BSGM) outputs. WorldPop, University of Southampton, UK. doi:10.5258/SOTON/WP00698
- Luxen, D., & Vetter, C. (2011). Real-time routing with OpenStreetMap data. Proceedings of the 19th ACM SIGSPATIAL International Conference on Advances in Geographic Information Systems, 513–516. https://doi.org/10.1145/2093973.2094062
- Wu, Q. (2021). Leafmap: A Python package for interactive mapping and geospatial analysis with minimal coding in a Jupyter environment. Journal of Open Source Software, 6(63), 3414. https://doi.org/10.21105/joss.03414
- World Bank. (2019). Rural accessibility mapping. [online] Available at: https://www.worldbank.org/en/data/statistical-capacity-building/data-innovation-fund/Rural-accessibility-mapping [Accessed 4 Dec. 2025].
Additional Resources
- GitHub: contains all the raw data and scripts used to produce the analysis and charts in this article.
- Technical Notes: contains more details on the methodology, early results, and additional charts to explore.
Appendix
Bandar vs Luar Bandar Areas (Estimated)
An interactive plot of population points broken down by bandar and luar bandar areas. Note that these classifications are estimates only (click on this link for a full-screen version of this map).
Change in Travel Time Between Primary and Secondary School
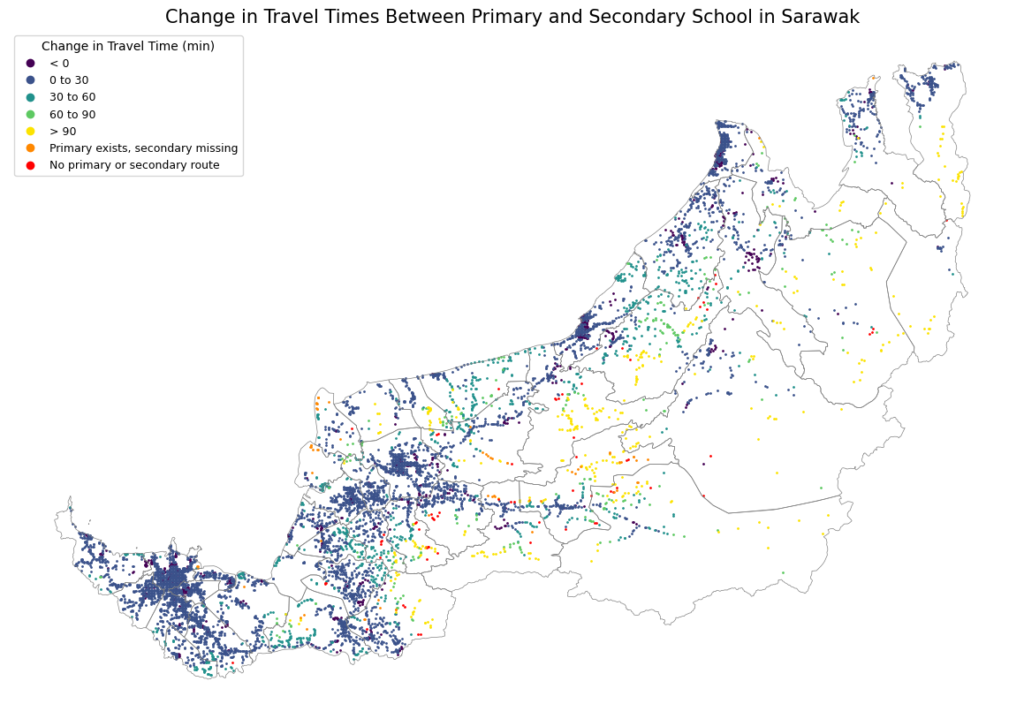
An interactive plot of the change in travel time between primary and secondary schools for each population point (click on this link for a full-screen version of this map).
Change Log:
- 28/01/2026 – First published
Footnotes
- Note that the base WorldPop data used for this analysis is the older ‘Global1’ dataset rather than the newly released ‘Global2’ dataset as this analysis was already in relatively advanced stages by the time ‘Global2’ was released. ↩︎
- The method was reimplemented manually in a local copy of OSRM to allow custom routing unique to Sarawak’s context. By default, OSRM only calculates for car, pedestrian, and bicycle routes. But in rural Sarawak, routes often include ferries, unpaved (logging) roads, and rivers. I adapted the method to account for these additional travel modes. Technical details and installation instructions can be found in the technical notes. ↩︎
- 60 mins is chosen as the threshold because it is a reasonable extreme, but other thresholds can be considered in future sensitivity analyses. ↩︎
- Not all river transport is automatically bad. Only those that remain costly, long, or unreliable (i.e. weather dependent). ↩︎
- The Ministry of Education (MOE) classifies school infrastructure using a seven-point condition scale. Schools deemed dilapidated fall under Categories 6 or 7. Category 6 refers to facilities that are inadequate, non-functional, or unsafe to use, posing risks of injury or loss of life, as identified by technical teams at the JPN/PPD level. Category 7 denotes facilities with similar risks that have been formally declared unsafe and life-threatening by JKR (Source: Wiki Impact). ↩︎
- In practice, different definitions of dilapidated schools are used, resulting in varying estimates. For example, in 2017, before MOE definitions were introduced, internal Sarawak Government definitions identified up to 1,020 dilapidated schools; applying MOE definitions to the same set reduced the estimate to around 415 (Source: Dayak Daily). Regardless of the definition used, the conclusion is the same: school infrastructure conditions are poor and require urgent attention. Debating how poor conditions have to be before being considered dilapidated is less constructive than addressing the underlying problem. ↩︎
- MOE data show that funding was approved for 390 dilapidated schools in Sarawak between 2016 and 2025. Of these, 275 were completed before the ministry later identified 555 dilapidated schools, suggesting they are excluded from this count. This implies that only 115 of the 555 dilapidated schools currently have approved funding and are either under construction or in the pre-construction phase. ↩︎
- An example: A Global Road Surface Type Classification Dataset Powered By Deep Learning and Mapillary Data – Geoawesome ↩︎
Leave a Reply